This tool does not require users to install a large number of debugging tools in remote or custom environments. Using the gdbserver program, it automatically attaches to the target.
In addition, this tool supports one-click launch of the strace program to observe current system calls and the current memory mapping addresses of the program.
The main program is written in C, making it easy to compile and use on Linux systems, helping you solve cross-architecture issues.
General: -e CMD service argv -p PID attach to PID -o CMD get pid by popen -h print help message -m enable multi-service -s halt at entry point -v show debug information -n disable address space randomization -u do not limit memory
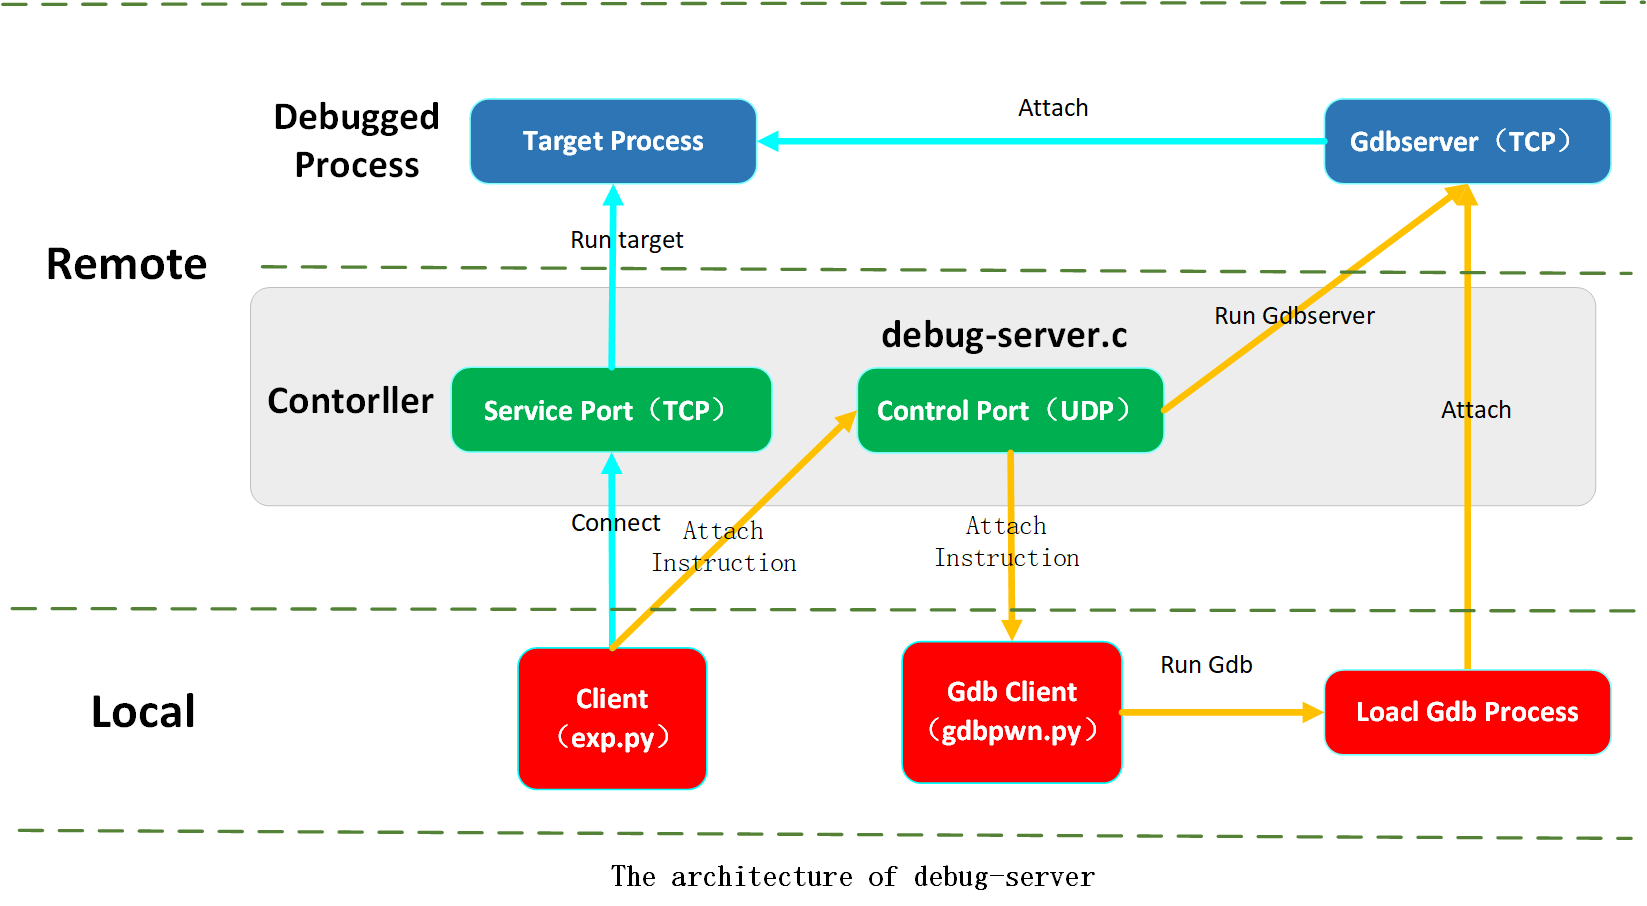
The debug-server provides several simple interfaces:
attach(script=''): Attaches to the target process, where script is the gdb pre-execution script passed in.
strace(): Straces the target process, with strace information output to the debug-server logs.
address(search:str): Obtains the address of the corresponding library of the target process from /proc/pid/maps. For example, address(‘libc.so.6’) retrieves the address of the libc library.
run_service(): Runs the service, an API commonly used for network services like Apache and Nginx.
Dependencies
The remote environment needs to have gdbserver and strace installed to ensure the service operates correctly.
The local environment needs to have gdb-multiarch and pwntools installed to ensure the service operates correctly.
Usage Example
The remote and local environments can be the same, but to highlight the convenience of debug-server for embedded systems, the remote environment used here is an aarch64 architecture system.
The remote environment uses a non-desktop Debian GNU/Linux 12 (bookworm) aarch64 architecture.
The local environment uses a desktop Ubuntu 24.04 LTS x86_64 architecture.
Then, use gdbpwn.py locally to connect to the corresponding remote IP:
$ gdbpwn.py 192.168.1.8
2024-05-19 18:17:28,277 : INFO : Connecting to 192.168.1.8:9545
2024-05-19 18:17:28,282 : INFO : It has connected successfully
2024-05-19 18:17:28,282 : INFO : Start gdb client
Next, insert the required debugging code into exp.py:
#!/usr/bin/env python3 # -*- coding:utf-8 -*-
from pwn import * context.clear(arch='amd64', os='linux', log_level='debug')
Your Code refers to the debugging code you need to write.
Simple Debugging Example
Here’s a debugging example. You just need to replace the Your Code section with the code below. This example demonstrates how to debug a program simply.
sh = remote(attach_host, 9541)
sh.recvuntil(b'Input: ')
attach()
sh.sendline(b'Hello world')
sh.interactive()
The output of exp.py locally is as follows:
$ python3 exp.py
[+] Opening connection to 192.168.1.8 on port 9541: Done
[DEBUG] Received 0x7 bytes:
    b'Input: '
attach successfully
[DEBUG] Sent 0xc bytes:
    b'Hello world\n'
[*] Switching to interactive mode
$
The output of gdbpwn.py locally is as follows:
$ gdbpwn.py 192.168.1.8 2024-05-1918:17:28,277 : INFO : Connecting to 192.168.1.8:9545 2024-05-1918:17:28,282 : INFO : It has connected successfully 2024-05-1918:17:28,282 : INFO : Start gdb client 2024-05-1918:21:49,450 : INFO : Receive COMMAND_GDBSERVER_ATTACH pwndbg: loaded 157 pwndbg commands and46 shell commands. Type pwndbg [--shell | --all] [filter] for a list. pwndbg: created $rebase, $base, $ida GDB functions (can be used with print/break) Remote debugging using ::ffff:192.168.1.8:9549 ... Breakpoint 1at0xaaaab8580000 ... ─────────────────────[ DISASM / aarch64 / set emulate on ]────────────────────── ► 0xffff9a219e64 <read+36> svc #0 <SYS_read> fd:0 (socket:[3088]) buf:0xffffd4b72538 ◂— 0 nbytes:0xff 0xffff9a219e68 <read+40> mov x19, x0 0xffff9a219e6c <read+44> cmn x0, #1, lsl #12 0xffff9a219e70 <read+48> b.hi #read+148 <read+148> 0xffff9a219e74 <read+52> mov x0, x19 0xffff9a219e78 <read+56> ldp x19, x20, [sp, #0x10] 0xffff9a219e7c <read+60> ldp x29, x30, [sp], #0x30 0xffff9a219e80 <read+64> ret 0xffff9a219e84 <read+68> mov x20, x2 0xffff9a219e88 <read+72> str x21, [sp, #0x20] 0xffff9a219e8c <read+76> mov x21, x1 ───────────────────────────────────[ STACK ]──────────────────────────────────── ... pwndbg>
Automatic Breakpoints
Here is an example demonstrating how to automatically set breakpoints. First, let’s look at the disassembly of the echo program:
This time, our goal is to set a breakpoint at 89c. The corresponding debug code is as follows:
sh = remote(attach_host, 9541)
sh.recvuntil(b'Input: ')
attach(
f'''
b *{address("echo")+0x89c}
c
''')
sh.sendline(b'Hello world')
sh.interactive()
After setting the breakpoint at 89c, the c (continue) command is executed immediately. This allows the program to run directly to the 89c breakpoint without manual adjustments, significantly speeding up the debugging process.
The local output of gdbpwn.py is as follows:
Breakpoint 1at0xaaaae31d0000 Breakpoint 2at0xaaaae31d089c: file echo.c, line 12.
Typically, using gdb to set breakpoints for programs like PHP and Nginx, which require importing lib libraries, is challenging. However, this debugging mode can address this limitation.
For example, if you need to set a breakpoint at the 8th byte offset of the entry point of the write function, the disassembly of libc.so.6 is as follows:
sh = remote(attach_host, 9541)
sh.recvuntil(b'Input: ')
attach(
f'''
b *{address("libc.so.6")+0xd9f18}
c
''')
sh.sendline(b'Hello world')
sh.interactive()
First, the address of libc.so.6 is obtained, and then a breakpoint is set at the corresponding offset. This process is automated, facilitating debugging of lib libraries. This is especially useful for libraries without symbol functions, making the debugging process significantly more efficient.
For network applications like Nginx and sshd, since they interact through sockets rather than standard input and output streams, the debugging process is often very cumbersome. Additionally, when problems arise, it usually requires restarting the service.
Here, we demonstrate using debug-server to debug such network programs.
On the remote environment, enter the following command to start debugging the target program:
./debug-server -e /usr/sbin/sshd -o 'pidof sshd'
The corresponding debugging code is as follows:
run_service()
time.sleep(1)
attach()
sh = remote(attach_host, 22)
sh.send(b'aaaa')
sh.interactive()
Before starting this debugging process, ensure that there are no already running sshd services on the current system.
The run_service() function will execute /usr/sbin/sshd, then time.sleep(1) pauses the debugging script for 1 second to ensure the sshd service starts successfully. The attach() function attaches to the target process, locating its PID by executing the popen function with the pidof sshd command. This corresponds to the -o 'pidof sshd' parameter.
This debugging method can greatly simplify the debugging process for network applications.
Disabling Randomization
To disable randomization for the target program when starting the remote debugging service, add the -n parameter.
./debug-server -n -e ./echo
This operation only affects the target program and does not change the system’s randomization rules, thus maintaining higher security.
Example of Using strace
For strace support, simply replace the attach() function with the strace() function.
The corresponding debugging code is as follows:
sh = remote(attach_host, 9541)
sh.recvuntil(b'Input: ')
strace()
sh.sendline(b'Hello world')
sh.interactive()
The corresponding remote output log is as follows:
Using this method, you can observe the system calls of the specified code, making it easier for researchers to understand the program.
Pausing at the Entry Point
For some programs without IO or programs that need modifications before the entry function, debugging with pwntools can be very cumbersome.
The debug-server can use the -s parameter to pause the program at the entry point, making it convenient to perform specific initializations, which is especially helpful for reverse engineering programs without IO.
The command to start the remote debugging service is as follows:
./debug-server -s -e ./echo
The corresponding debugging script is as follows:
sh = remote(attach_host, 9541)
attach(
f'''
b main
c
c
''')
sh.recvuntil(b'Input: ')
sh.sendline(b'Hello world')
sh.interactive()
Since debug-server uses the SIGSTOP signal to pause the program, the first c (continue) command handles the SIGSTOP signal, and the second c command continues the program execution.
The local gdbpwn.py output is as follows:
Breakpoint 1at0xaaaaac560000 Breakpoint 2at0xaaaaac560820: file echo.c, line 5.
If the entry point pause function is not enabled, the program will not stop at the entry point. The reason is that the IO speed is too fast. If the program is not paused, the IO speed will always be faster than the debugging speed, making it impossible to debug the code before the IO process.
Open Source Support
The debug-server uses the MIT open-source license. All interested geeks are welcome to join in the maintenance.